The Story About Airline Safety - Part 3 - Blog Post

This was a multi-part project broken down into different phases focused on certain types of visualizations.
The goal of this project was to use different types of data visualizations to adequately tell the story based on a hypothetical scenario. In this scenario, there has been consistent negative press after several high profile plane crashes. The public and media are beginning to question whether airlines are as safe as they have been reported to be. My job was to analyze the data and use different methods of data visualizations to describe the situation.
Following is the sample blog post describing the situation and key metrics used to highlight the pertinent data and its conclusions.
What’s Up With That?
The Story Behind Airline Safety in the New Millennium
Recent news reports have recently called into question the purported safety of the airline industry worldwide. Several high-profile crashes have made travelers weary of airline safety despite the generally positive track record of most airlines. This begs the question, are airlines still the safest way to travel? What does the data reveal about safety overall? The answer is complicated, but in general airline travel still appears to be one of the safest ways to travel.
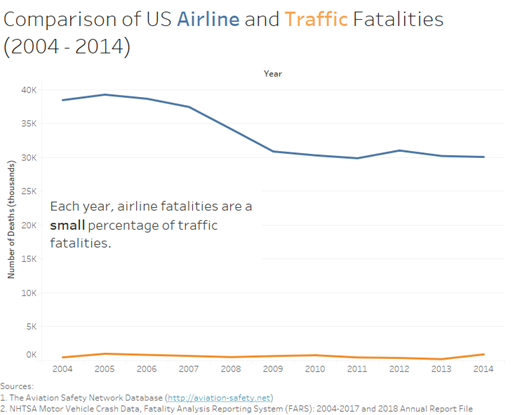
There is a vast amount of safety related statistics regarding airline travel. To start, we should compare airline safety with one of the most common modes of transportation – the automobile. Between the years of 2004 and 2014, the NHTSA has compiled motor vehicle crash data. There have been between 30,000 and 40,000 fatalities attributed to car accidents (NHTSA, 2020). Compare this overall airline fatalities for the same time range, and there are only approximately 1,000 fatalities per year and this trend appears stable. Airline fatalities are about 3% of annual motor vehicle crashes.
There are also differences between different countries and regions with regards to aircraft fatalities. When comparing US Airlines number of fatal accidents, 5 separate airlines were compared including Alaska, American, Delta, United, and US Airways airlines. The number of fatal accidents were compared between the periods of 1985-1999 and 2000-2014. With the exception of Alaska Airlines, the other four airlines showed a decrease in the total number of US accidents by about 25-50% (Airline Safety Network, 2020).
Total fatalities from aircraft accidents for the five airlines specified above tells a slightly different story. While the number of fatalities has decreased for Delta, United, and US Airways, American, and Alaska Airlines saw an increase in total fatalities. One factor that needs to be considered is the size of the airplane as well. Just because the number of fatalities has increased does not necessarily mean that airlines are having an increase in fatal incidents.
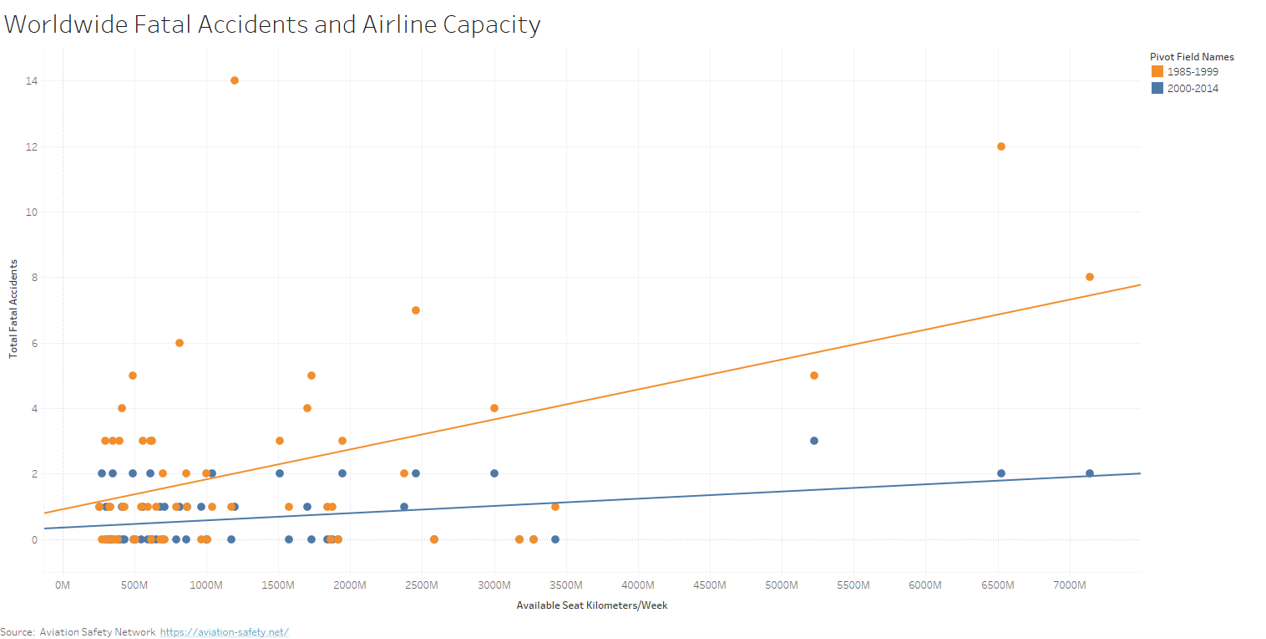
Airline capacity also plays a role. One way that airlines estimate capacity is through available seat kilometers/week. The statistic is used to show the overall capacity of airlines and is obtained by multiplying the number of passenger seats booked by the overall distance those flights will be in use (AirlineGeeks.com, 2015). If we compare the periods of 1985-1999 and 2000-2014 there is a trend towards an increase in fatal accidents as the available seat kilometers/week increases. However, this trend was much stronger when comparing flights before the year 2000 and the relationship is much flatter when considering fatal accidents after the turn of the millennium. This could suggest that airlines have seen a relative decrease in fatal accidents as airline capacity increases and that airlines have gotten safer as business and passenger volume has increased.
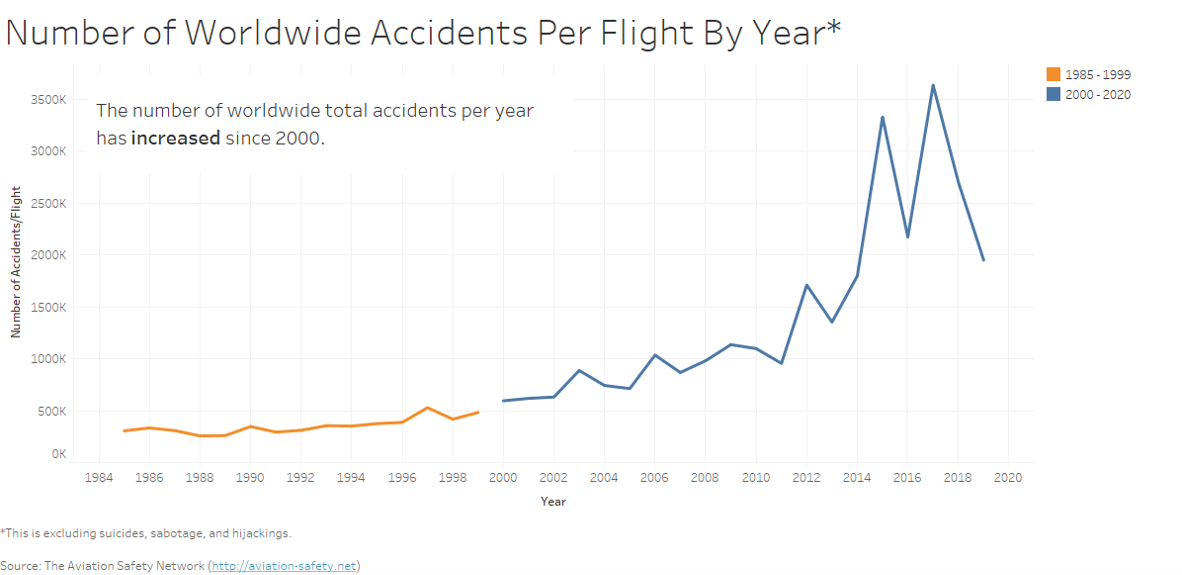
Some of the largest increases in the number of incidents have occurred in the Asian, Australian, and Gulf regions. Qantas and Gulf Air have seen a 200-400% increase in incidents after the year 2000. Southwest Airlines in the US actually saw the largest increase with a 700% increase in fatal accidents. This does not necessarily translate to fatalities. When looking at the number of accidents per flight by year, there is a trend towards an increase number of airline accidents worldwide with almost four times the number of accidents after the year 2000.
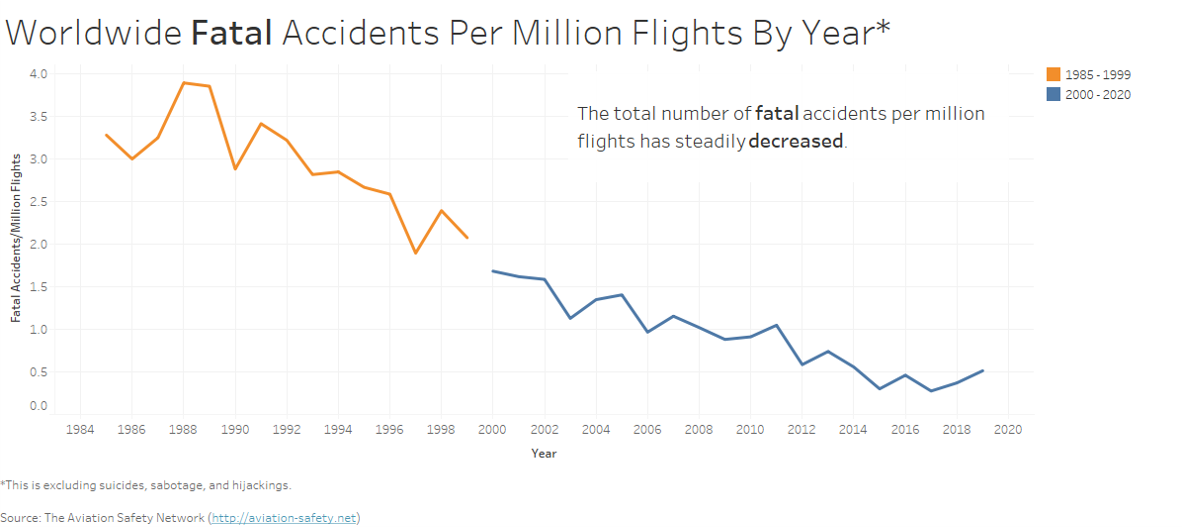
Yet, when looking at the same time period with the number of fatal accidents/million flights, there is a considerable decrease after the year 2000 from a 1985 level of almost 3.5 fatal accidents/million flights down to 0.5 fatal accidents/million flights in the year 2018 (Airline Safety Network, 2020).
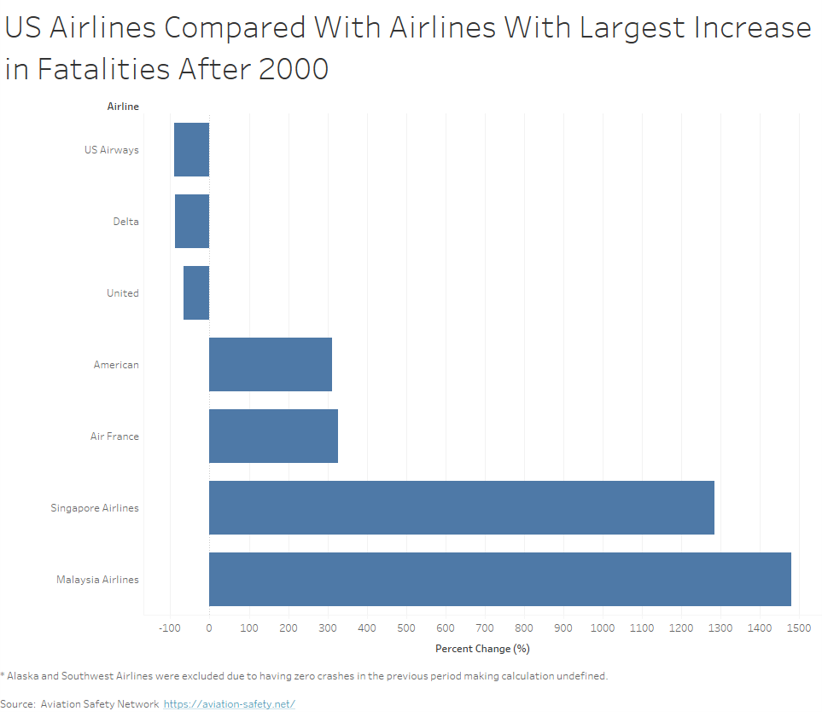
The largest percentage increase in fatalities after the year 2000 were Malaysia and Singapore airlines with a 1250 to almost 1500% increase. American had a 300% increase in fatalities as did Air France. US Airways, Delta, and United all saw a percentage decrease in fatalities. Once again, the specific airline crashes and the size of the airlines need to be considered in viewing these percentage increases as a high-profile large airplane crash will be reflected in a large percentage increase from one or a few incidents. (Airline Safety Network, 2020).
The economic impact of airline travel must be considered as well. In the year 1985, airline operating revenue was approximately 50 million dollars in the United States. Compare this to the year 2014 in which the annual operating revenue is 160 million dollars. This is 3 times the revenue approximately 20 years ago. Current estimates from Airlines for America estimate that airlines produce 5% of the country’s total gross domestic product and supports over 10 million jobs in the United States (Airlines for America, 2020).
So, what is the bottom line? When one considers the number of flights on a daily basis worldwide (pre-COVID-19 pandemic), it is a rarity to hear of a major airline incident, accident, or an airline crash. One airline crash while statistically unlikely can affect the numbers significantly given the low overall numbers of fatalities for airline related incidents worldwide. Compared to auto traffic accidents, airline fatalities are an extremely small percentage of lives lost while driving. Many people in the United States also fly rarely. While there certainly are exceptions to specific airlines, in general, airlines still appear to be a reasonably safe way to travel and is a large percentage of our country’s economy.
References Cited:
- AirlineGeeks.com. (2015, December 28). Airline Metrics: Available Seat Kilometers. Retrieved July 07, 2020, from https://airlinegeeks.com/2015/12/28/airline-metrics-available-seat-kilometers/
- Airlines for America. (2020). Annual Financial Results: U.S. Passenger Airlines. Retrieved July 07, 2020, from https://www.airlines.org/dataset/annual-results-u-s-passenger-airlines/
- Airline Safety Network. (2020). Airline Safety. Retrieved July 07, 2020, from https://aviation-safety.net/airlinesafety/
- NHTSA. (2020). National Highway Traffic Safety Administration. Retrieved July 07, 2020, from https://one.nhtsa.gov/Data